Rubin-etal
Ken Rubin (Univ. of Hawaii), Adam Soule (WHOI), Bob Embley and Bill Chadwick (NOAA-PMEL), and Dan Fornari (WHOI)
Volcanic eruptions at mid-ocean ridges and other submarine volcanoes are fundamental “events” that impact nearly every aspect of the biogeochemical system, including: resurfacing the seabed, partially draining magma chambers, inducing seismicity and slip on faults, initiating new faults and fissures, impacting hydrothermal circulation patterns and conditions of water-rock exchange in the crust, altering seafloor morphology, perturbing both vent and non-vent ecology, and causing the exhalation of large quantities of fluids and crust-dwelling microbes into the overlying oceans.
The timing, frequency and spatial extent of eruptions are important for establishing a “time zero” point to assess the recovery of the volcanic system and/or if there were multiple “reset” points closely spaced in time. These parameters are also crucial for an understanding of the longer term evolution of the volcanic system. An important question that has generally not been quantitatively addressed is the duration and spatial extent of perturbations caused by eruptions within the crust, on the sea floor, and in the overlying water column, or their overarching controls. Such information – time since the last eruption or intrusion and the size and duration of an event – is essential for interpreting biological, hydrothermal and geological observations at submarine volcanoes in the years and decades following and/or preceding magmatic events.
A great deal of information from observations at a dozen or so sites in the past 25 years can be synthesized to develop a greater understanding of the relevant spatial and temporal scales of eruption–related phenomena. For instance, eruptions at 9° 50’N EPR, with fissure lengths of ~10-20 km, impacted hydrothermal sites tens of km outside the zone of lava emplacement. Hydrothermal fluids at chimneys within the eruption zone showed a continual decay of compositional effects for nearly a decade after the 1991-92 eruption. These fluids then began to reverse some of these compositional variations a few years prior to the next eruption (in 2005-06). Both of these EPR eruptions produced lava flows over a period of six months or more. The 1998 Axial Seamount eruption was shorter in duration, and the number and intensity of pre-existing hydrothermal vents increased for a time after the eruption, after which it returned more or less to pre-eruption conditions. We don’t know the duration of the ca 1986 N. Cleft eruption and a slightly older related sheet flow on the Juan de Fuca Ridge (JdF), but there was limited focused hydrothermal flow up to 2 years after the eruption. Other eruptions, such as the 1993 Coaxial eruption on the Juan de Fuca Ridge and the 1996 N. Gorda Ridge eruption were short lived events that did not spawn active, focused hydrothermal flow, and had only short-lived biological effects in the immediate vicinity of the eruption.
It is useful to ask what caused the aforementioned differences? Are they effects of different volumes of erupted magma, conditions of lava effusion, magma storage depths in the crust, and/or crustal fracture regimes, perhaps influenced by eruption locations nearer to segment centers or segment ends?
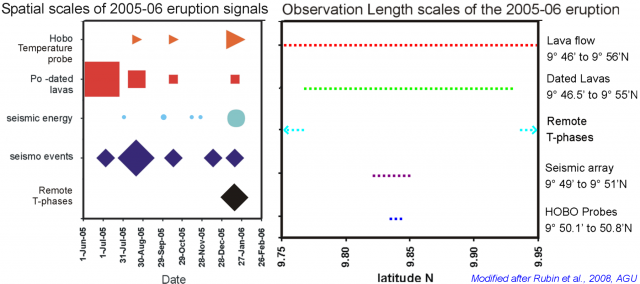
Another key to the time and length scales of eruptions comes from monitoring data collected during and between sea floor eruptions. In situ seismic data, remotely detected T-phase seismicity, hydrothermal fluid exit temperatures, high-resolution lava eruption ages, long-term ground deformation monitoring (inflation/deflation), and depth changes (which can constrain erupted volumes) are available for one or more eruption, and tell a complex story of the event(s) that occurred. No two records tell exactly the same story, and in some cases, are contradictory (such as eruptions at Loihi in 1996 and 9° 50’N EPR in 2005-06 that produced little if any obvious change in regional seismicity). Examples of some of these types of differences are shown graphically in the attached figure for the 2005-06 EPR ISS eruption.
The first step towards understanding the temporal and spatial scales of eruptions is to compile all the relevant data collected at and near eruption sites by a long list of individuals operating under the auspices of RIDGE Event Detection and Response, R2K Time Critical Studies, NOAA-Vents program, and independent responses. Next would be to look for similarities and differences between the catalog of known events, and to compile eruption metadata from the principals in those studies, some of which is not well documented in the literature. These data can then be compared to more intensively monitored volcanoes in terrestrial environments and finally the data can be integrated into one or more papers. It is anticipated that the “geologically” focused effort described here will dovetail with companion efforts aimed at understanding the biological evolution of the sea floor at active volcanic sites.
----------
Figure caption: Magnitudes of signals with time and spatial scales of observational data from the EPR 2005-06 eruptions. The sizes of the symbols in the left panel are proportional to the relative magnitude of each parameter at different points in time. The plot illustrates that different aspects of the system responded differently to, and thus recorded, different aspects of the eruption. Figure from Rubin et al. in prep, modified from Rubin, KH, Tolstoy, M, Fornari, D J, Dziak, R P, Soule, S A, Waldhauser, F, Von Damm, K L (2008) Integrating Radiometric, Geophysical and Thermal Signals of Volcanic Unrest and Eruption in 2005-06 at 9 deg 50'N EPR, Eos Trans. AGU, 89, Fall Meet. Suppl., Abstract # B23F-07

